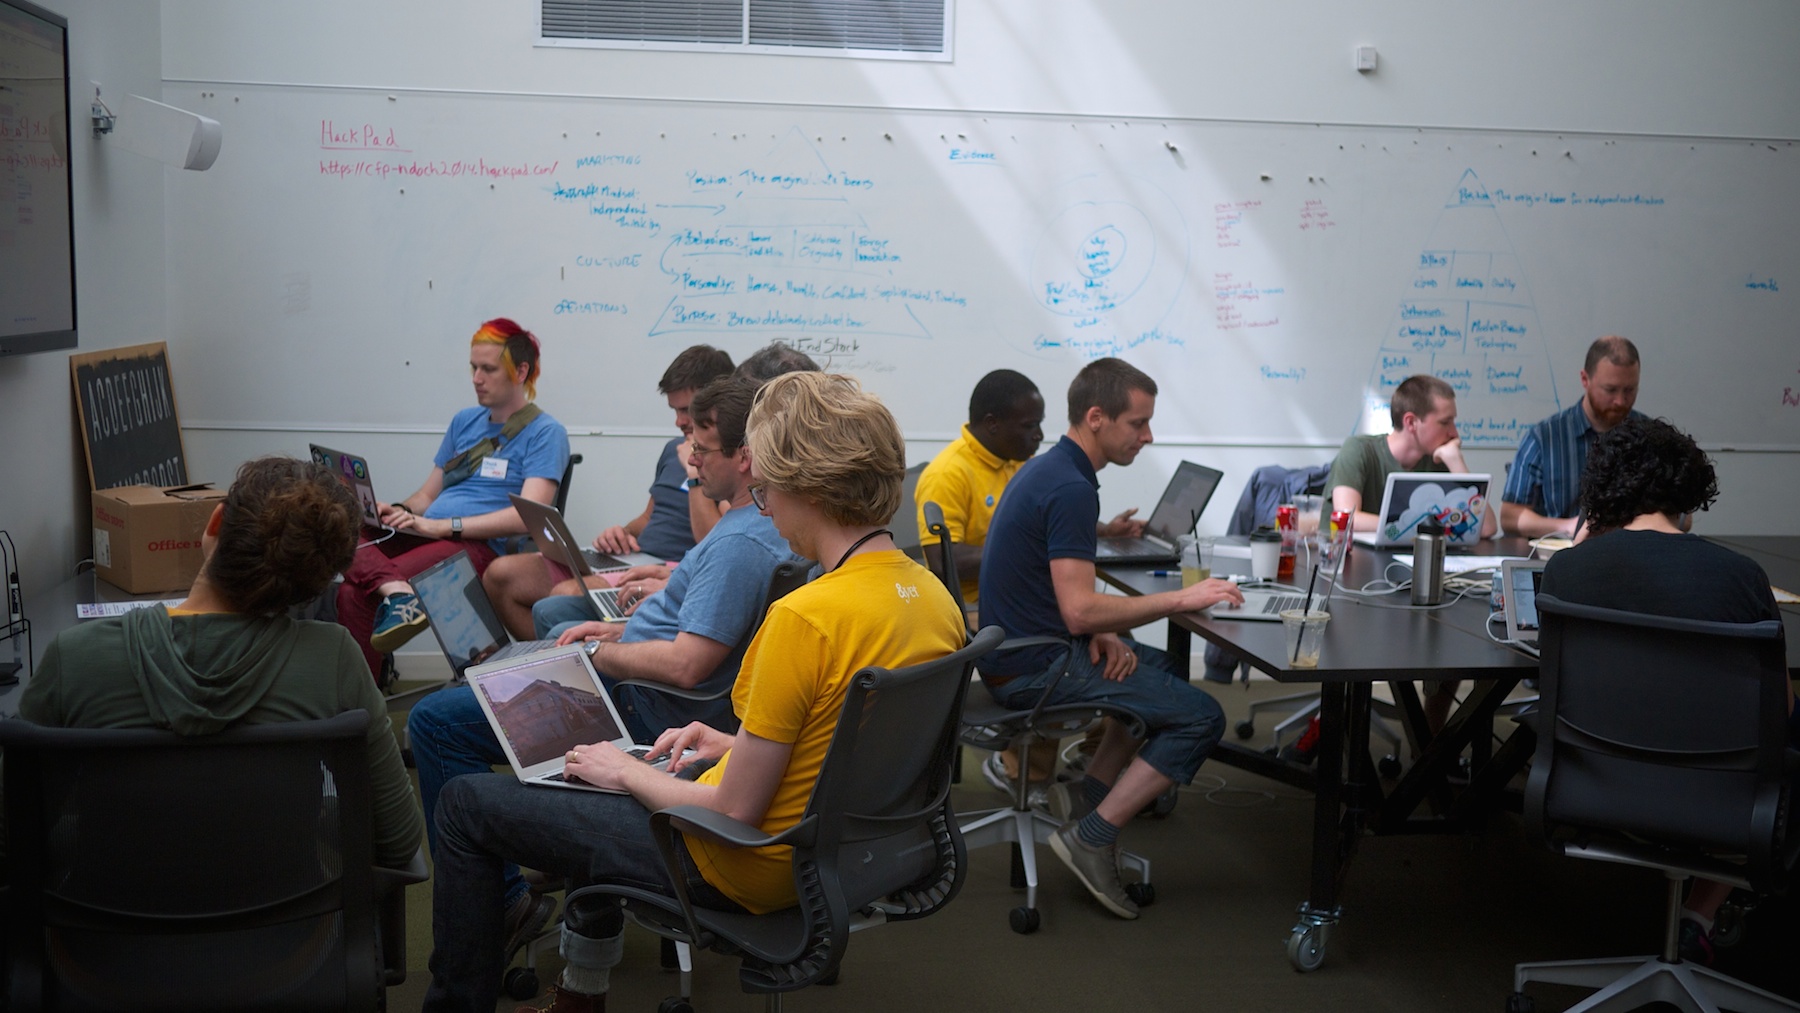
A huge THANK YOU to everyone who joined us this weekend! As Erica has already said to the project leaders, “I can hardly believe how much we got done, how absolutely stellar the quality of work was, and how much sharing and collaboration and community building we all did!”
We’d also like to thank our sponsors, Esri, Fine Design Group, Epicodus, North, and Urban Airship, without which this event would not have been possible. Esri, Fine, and Urban Airship provided the food and beverages, while Epicodus and North provided awesome venues. There are lots of great pictures and moments to remember on our Twitter feed.
Keep reading for more info on the projects, and you can even find some of them on the main NDoCH site. And if you aren’t already on the Code for Portland Google group, you can join and get all the details and updates on projects. And we’ll keep hacking on them (and probably start some new ones) at our next Hack Night on June 17th.
Finally, we want to invite you to join us for a fun group hike (Hike for Portland) this Saturday (June 7th) to stretch our legs and test some of the open trail data apps we worked on last weekend. Take a look at the Code for Portland Meetup group for all the info!
Project reports
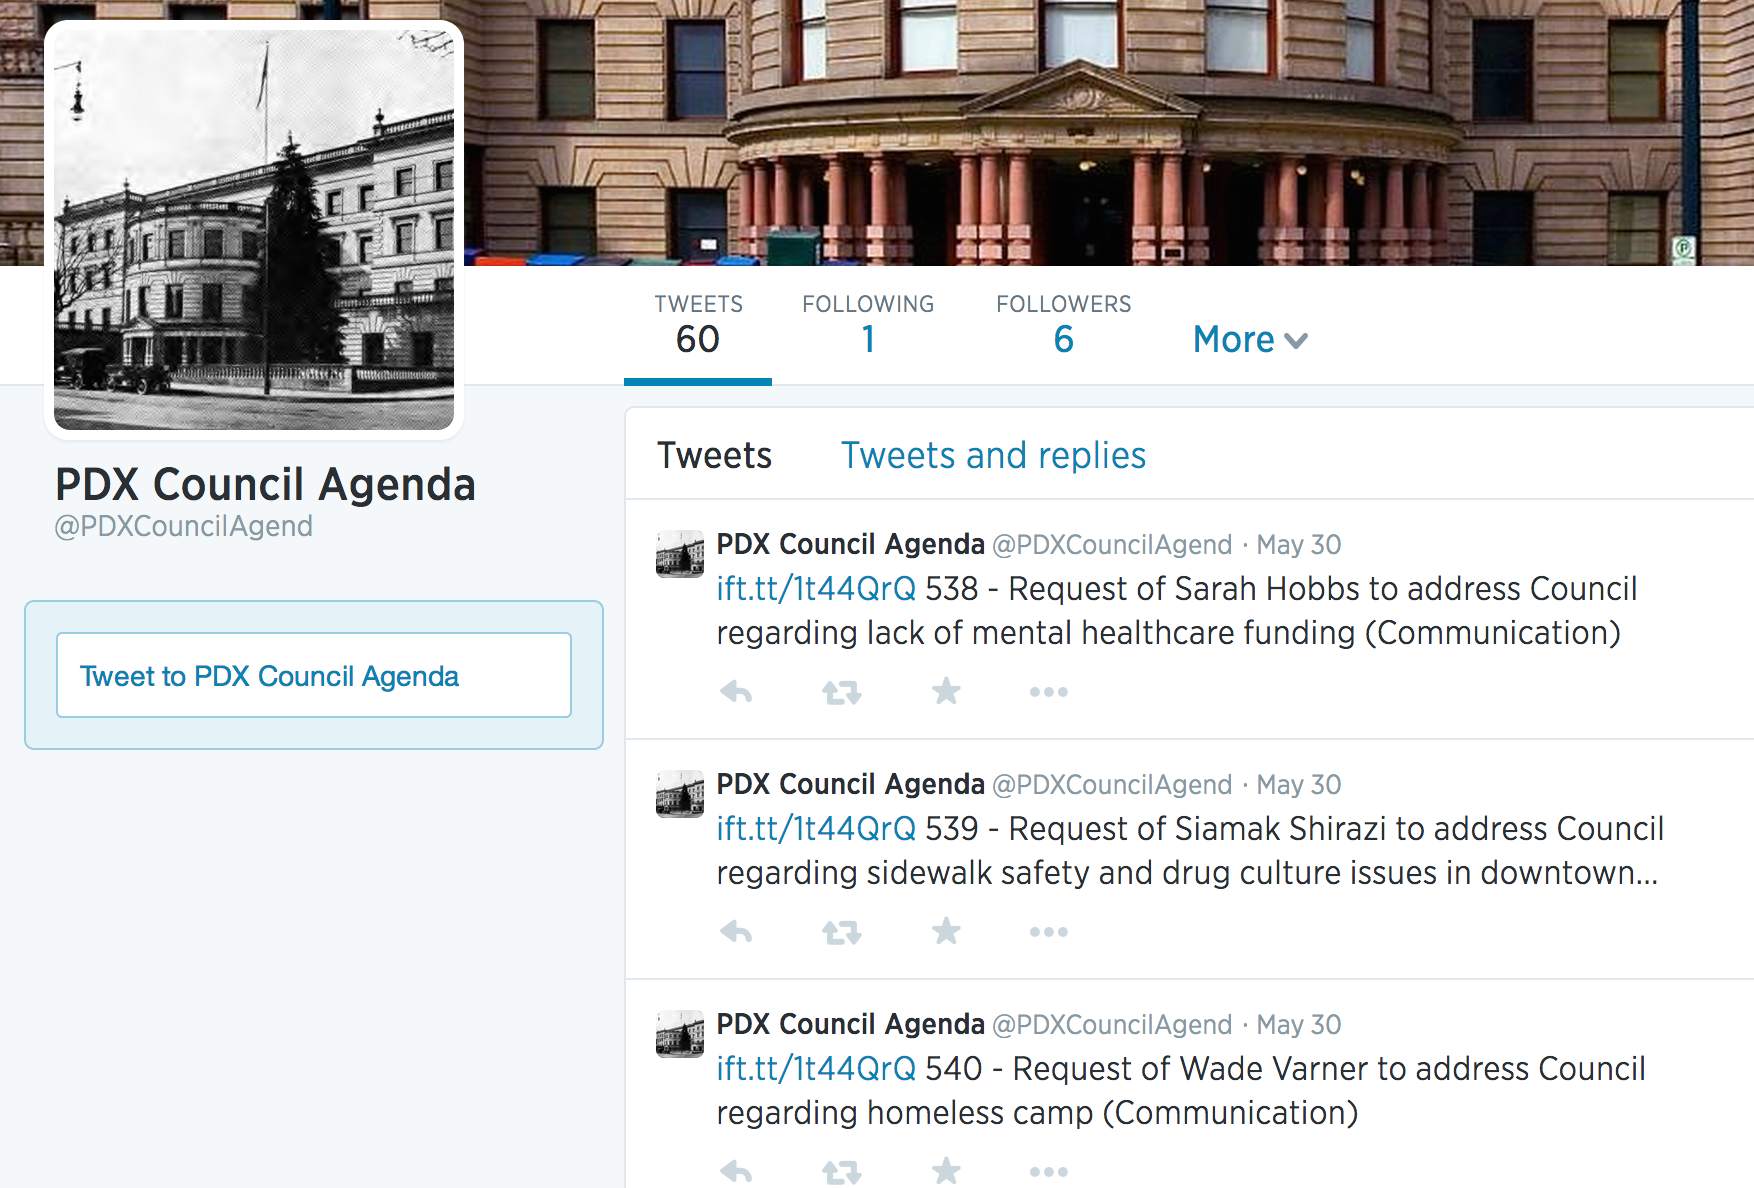
Portland City Council Agenda Bot Project
Project repo: github.com/donpdonp/council-report
This project idea was brought up by the city a few years ago - they wanted broader public input and engagement on the agenda, ideally before the week’s meetings began.
Because it’s really important to us to be collaborative and not re-implement work already being done, we took time to do some research and discover what, if any, similar efforts have already been made. Although we found a similar project from three years ago, after contacting one of the maintainers, we were able to confirm that it was no longer active.
Now, we have a scraper that scrapes council agenda items from the City of Portland Council Agenda Page and from there it creates a JSON feed that is consumable by anything. For example, there is an IFTTT (If This, Then That) that takes the JSON feed and posts it to Twitter and to Facebook, and we also have a bot that posts agenda items to Reddit for community discussion.
Hack Oregon “Behind the Curtain” Campaign Finance Visualization Project
Project repo: github.com/hackoregon
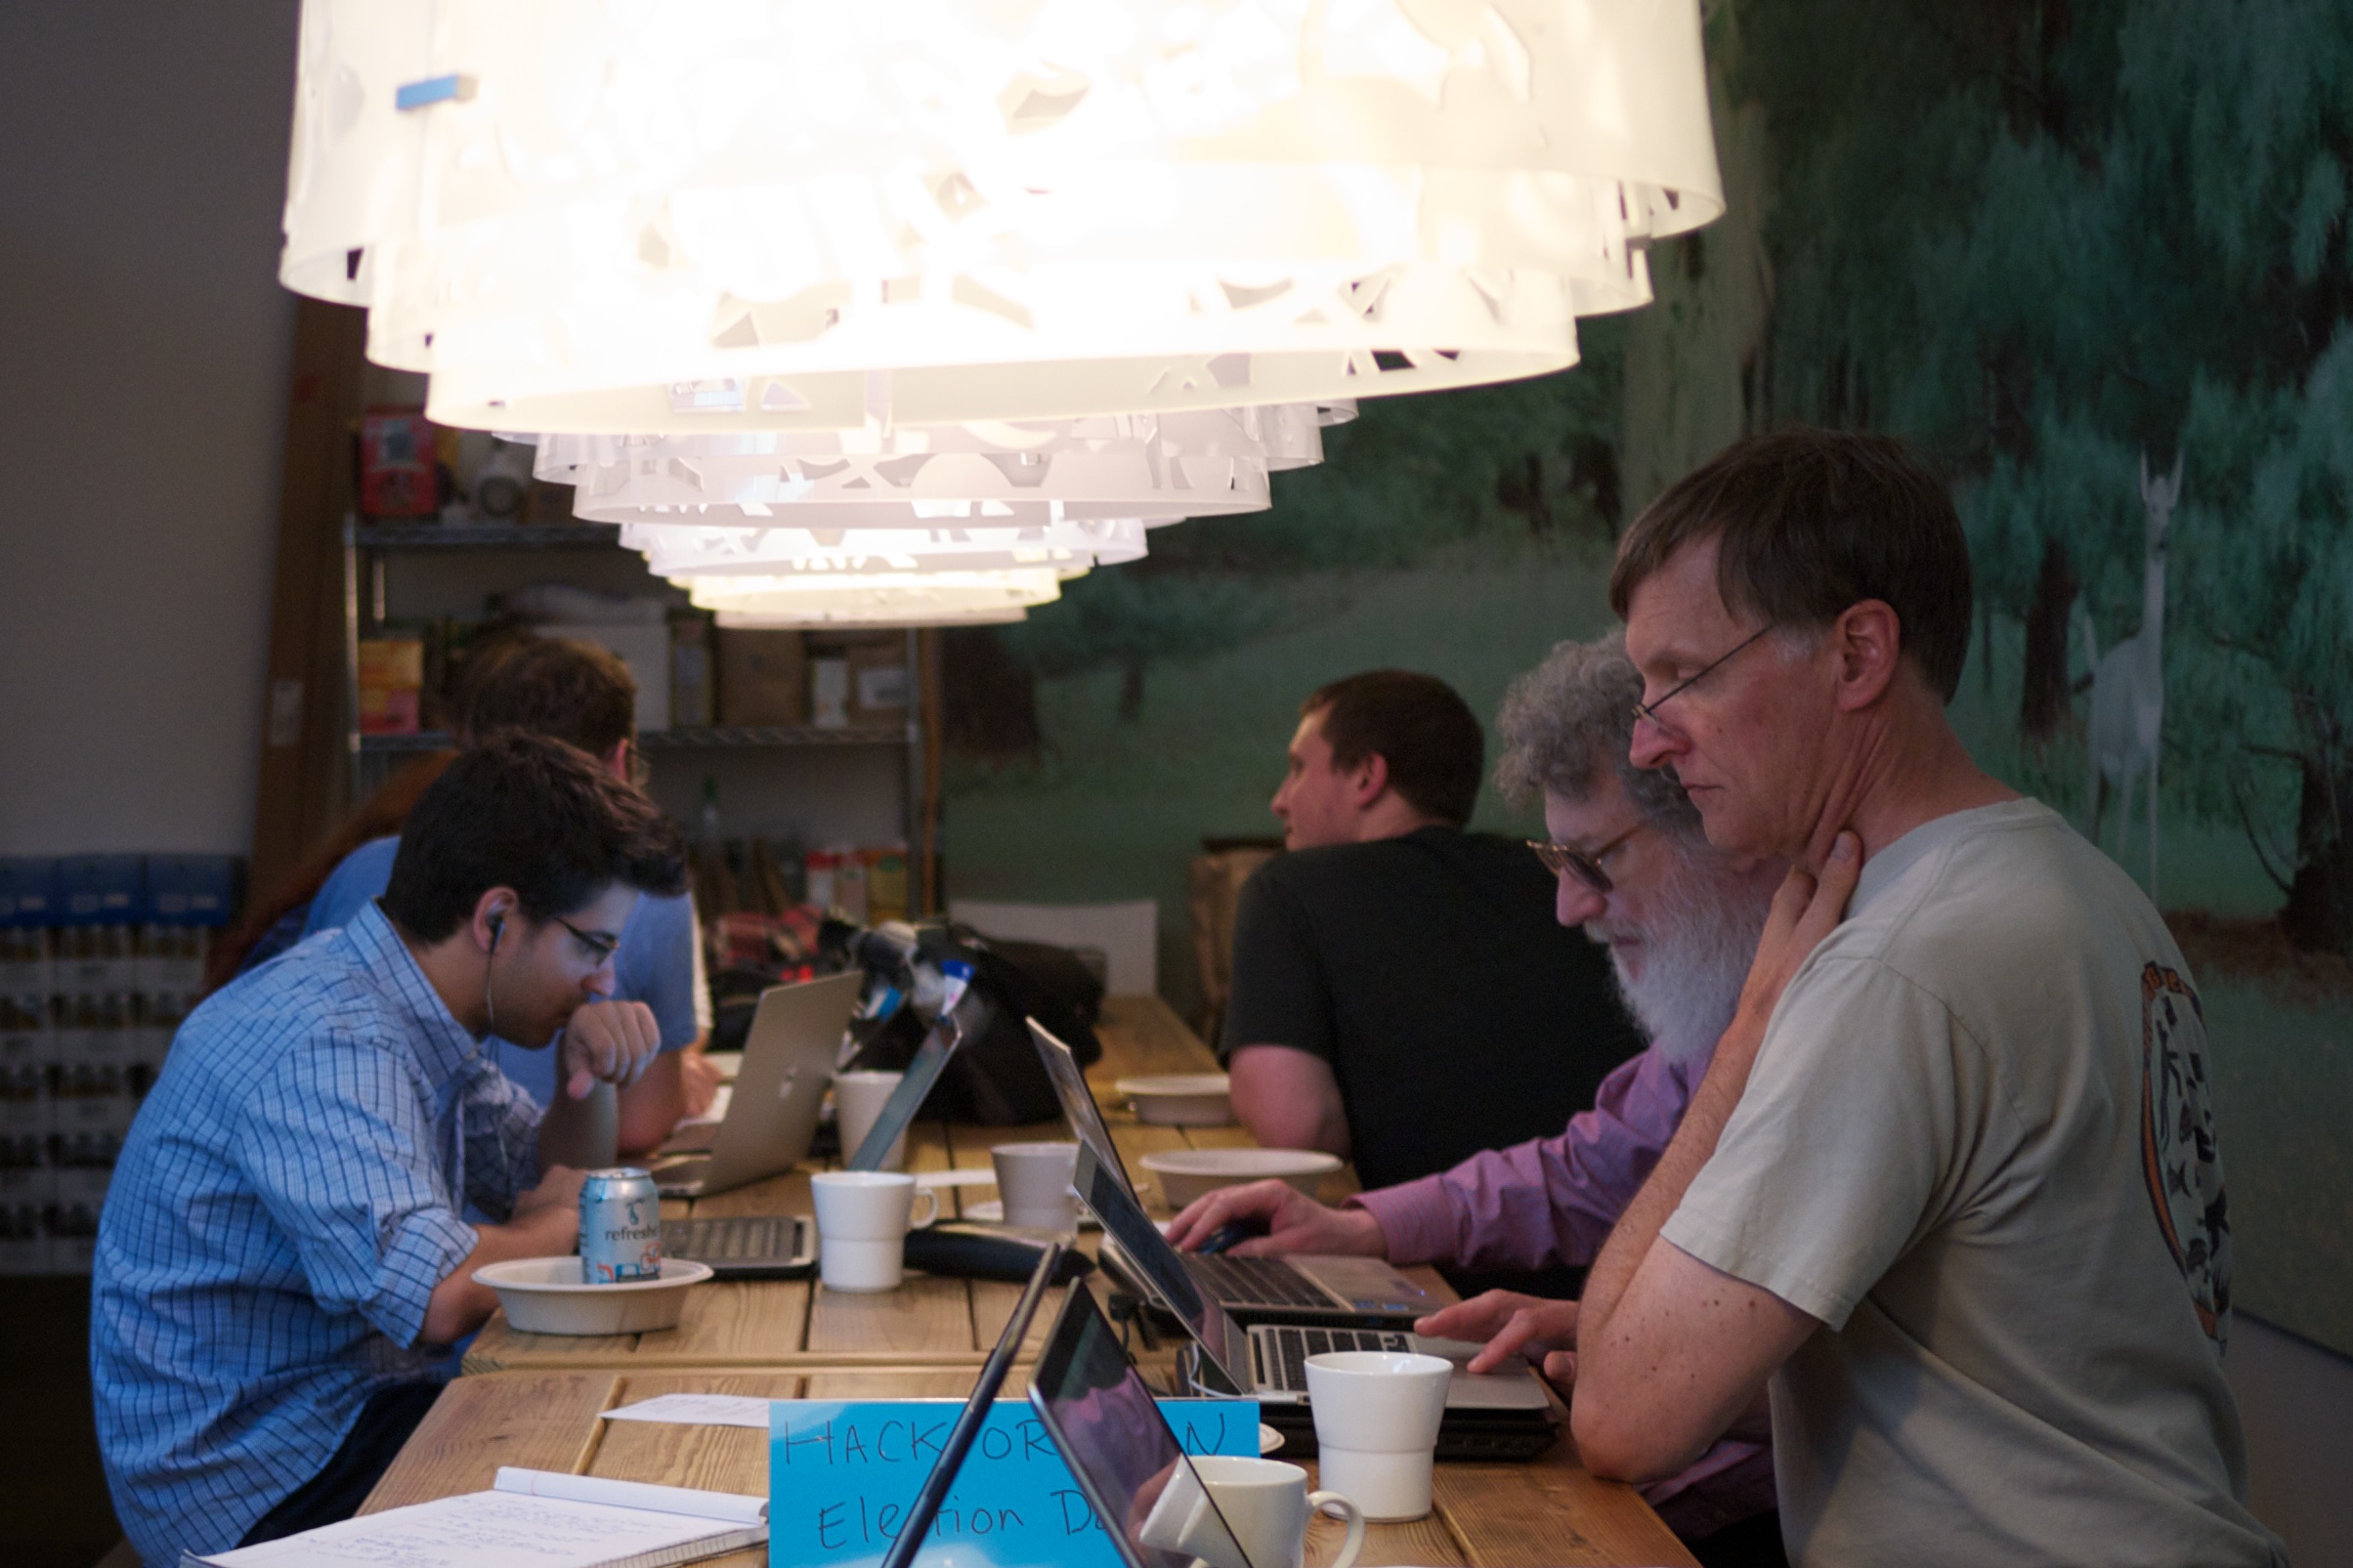
Hack Oregon is a non-profit group focused on building local civic data projects in Portland and Oregon. They are currently working on beta launch for their “Behind the Curtain” project to visualize campaign finance information for the 2014 election year.
For the National Day of Civic Hacking, their Spatial Data Team have been working on standardizing a database to define district lines down to the local county level. This will allow for better searchability for people wanting to know who all their representatives are and which seats are up for re-election.
Follow their project and keep updated on the launch at hackoregon.org.
PDX Trails Project
Project Repo: github.com/mbcharbonneau/PDX-Trails
Metro has a whole lot of really great data about bike and pedestrian counts in Portland and lots of info about how people use the trails. All of it is in spreadsheets right now and they want to find a way to visualize the data and make better use of it.
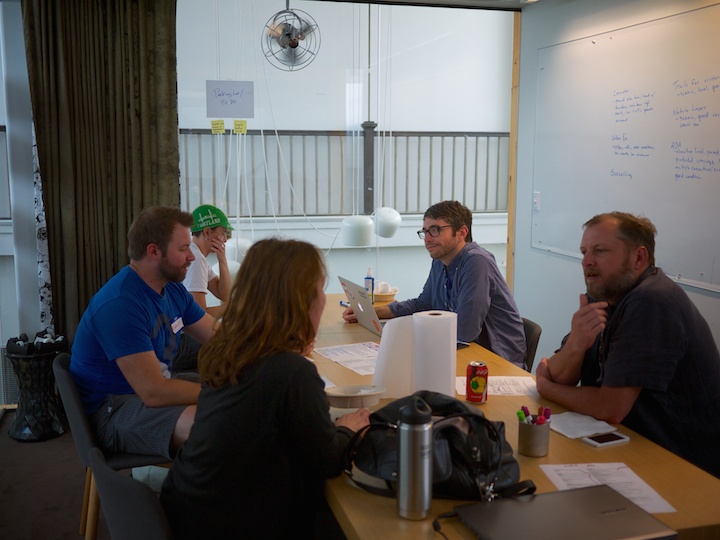
The team brainstormed ways to use this data and came up with some great ideas that can really help people and show useful information. For example: we can show trails that are ADA accessible and where they are, trails that have parking nearby, protected crossings, safe bike commuter routes, or are particularly scenic.
The project is a map application that asks questions to determine what trail you are looking for. You start with broader categories like biking or walking and narrow your focus from there based on what matters most to you.
Right now, we are working on importing PLATS compatible geometric trail data and assigning it the values from the spreadsheets and displaying it on the map in a heat-map style. So the trails that best fit your criteria will really stand out on the map for you. Eventually, you will also be able to tap on a trail and pull up more information about the trail.
Trail Editor Project
Project repo: github.com/trailheadlabs/trailheadit
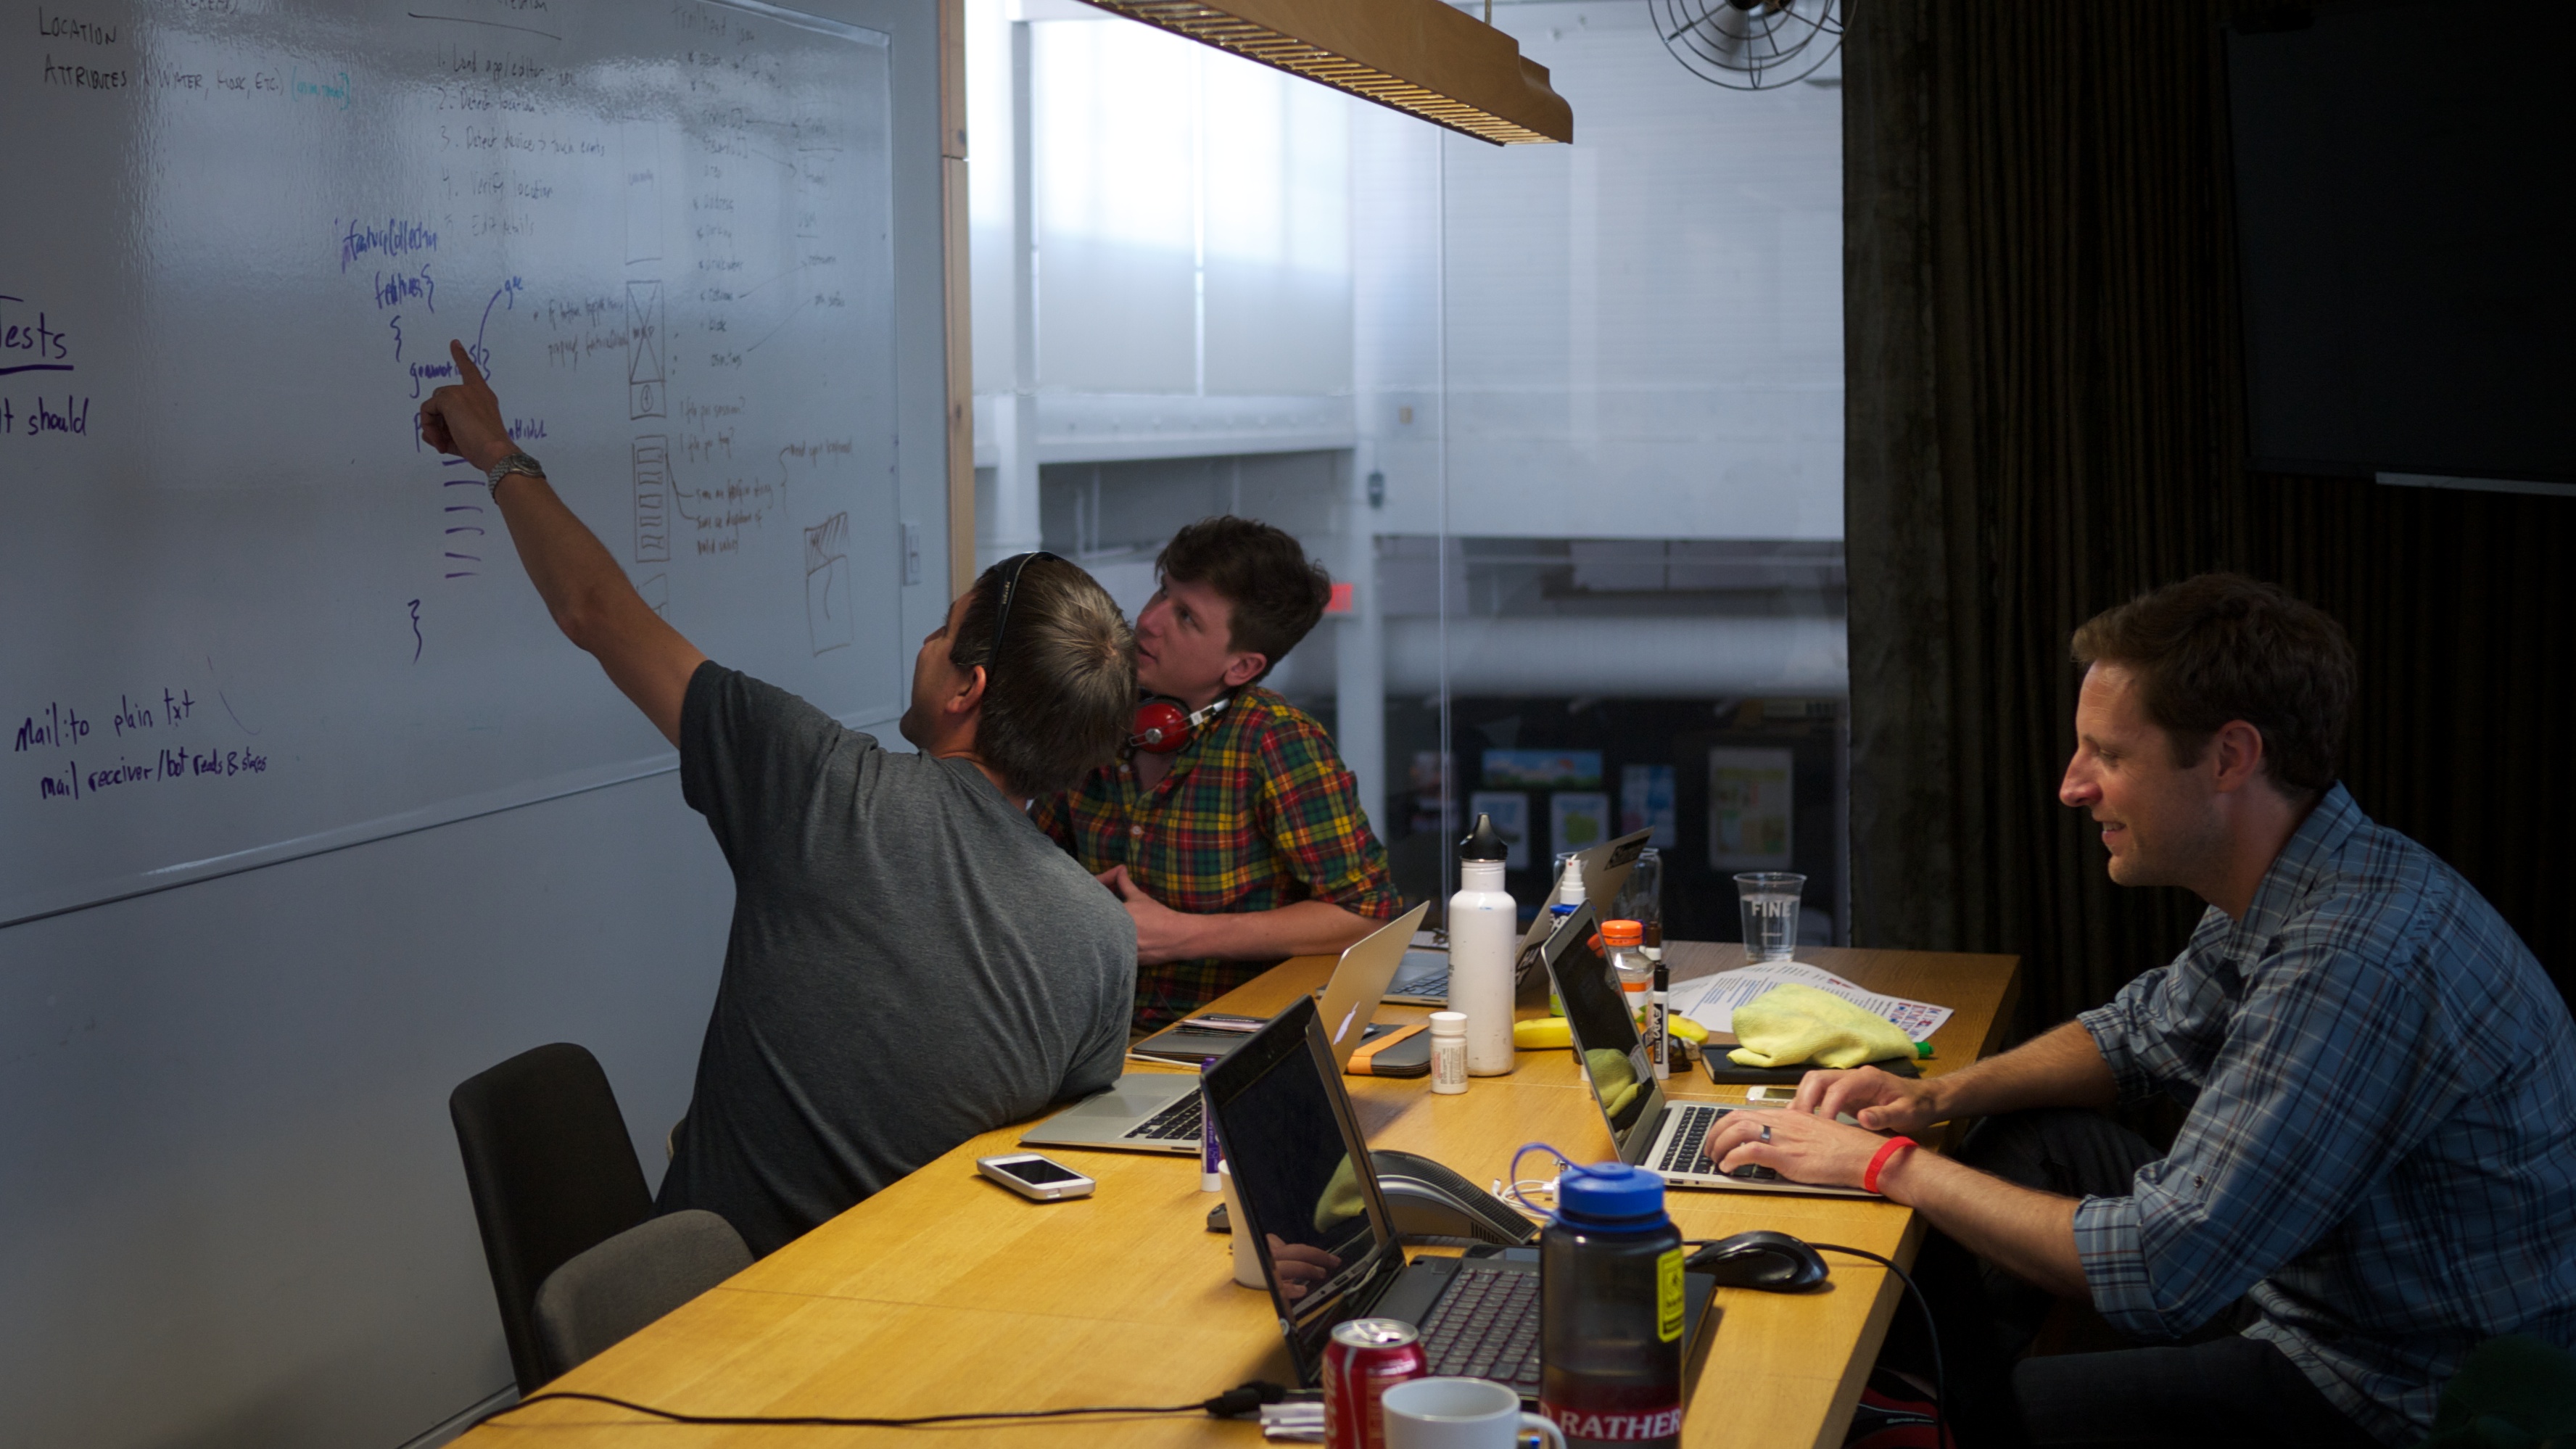
The Trail Editor team (Dale, Alan, Razaik, Ryan and Jereme) worked with Oregon Metro to develop a better way to collect trailhead and point of access locations for the region’s trail network. Metro is about to undertake an effort to inventory all of these points, and the Trail Editor team set out to help them. Trailhead data is an important data set for geospatial analysis of trail networks, and supports building applications designed to get people outside.
Trail Editor enables users to document trailheads in the field by taking a photo of a spot, and e-mailing it to a special agency e-mail address. Once sent, the Trail Editor app reads the photo file for latitude, longitude and elevation, then replies back to the e-mail with a link to view the documented trailhead. The user–whether it be a volunteer, staff person or visitor–can then describe the amenities available at that spot in more detail—such as whether bike parking, or bathrooms, or drinking water are available on site. Ultimately, park agencies will be able to download all this data in the OpenTrails format, creating a trailhead dataset they can use with their existing trail right-of-way data.
Wasteshed Visualization Project with Community Environmental Services
Project repos:
CES is a non-profit, housed within Portland State, that does research and program work on waste and recycling topics. They currently have some 25 years of quantitative data, all in spreadsheets and 17 current projects that are generating more data all the time.
They would like to figure out how to visualize and analyze waste stream data at a “wasteshed” level to find ways to influence member behavior, change the secondary market (purchase of materials to be recycled), and increase waste diversion.
We have an on-going partnership with CES to help them share their work with the community by creating a way to easily parse their existing data and have a platform for distributing and analyzing the aggregated data.
We started this project with the data they have collected from the Lloyd Eco-District, which is a group of businesses within the Lloyd Center area. The Lloyd Eco-District board is partnered with CES and are collaborating with them to analyze material sourcing and the waste stream at a level that transcends individual businesses.
At the Hackathon, we looked at a bunch of documents and pieced together what data is available to build off of, and as of Saturday morning, we have a awesome data structure to work with.This data structure will help CES organize their data better and make it easier for other groups to use their data for future projects as well.
The next step is to build a front end for data visualization and put it on a map using Lloyd Ecodistrict GIS data we got from our Metro representative. Our group also had a great time working together, everyone came with a different language background and we got to learn together and work together and figure out how to do ruby and frontend all together. There was a lot of great teamwork with everyone teaching each other.
Never stop hacking
See you all next time! We’ll keep having hack nights monthly, so if you can’t make it on the 17th, don’t worry, you can catch up in July.
Upcoming Events
- Hike for Portland, Saturday, June 7th
- Monthly Hack Night, Tuesday, June 17th